🛰️ Satellite Remote Sensing & Spaceborne Climatology
An exhaustive spaceborne remote sensing dissertation on Earth observation climatology. We derive Planck radiative transfer and radiative transfer equations (RTE), analyze multi-spectral infrared and microwave radiometry, evaluate radar altimetry sea level physics (Sentinel-6), derive satellite gravimetry mass flux (GRACE-FO), and examine photon-counting LiDAR (ICESat-2).
Prior to the dawn of the Space Age, human understanding of the global climate system was fundamentally crippled by geographical blindness. Climatologists possessed detailed weather records for populated European and North American cities, but the vast majority of the planet—the 71% covered by the world ocean, the trackless deserts, the impenetrable Amazonian jungles, and the frozen polar ice sheets—remained virtually unmonitored. Global average temperature calculations were little more than educated statistical guesses cobbled together from coastal harbors and shipping lanes.
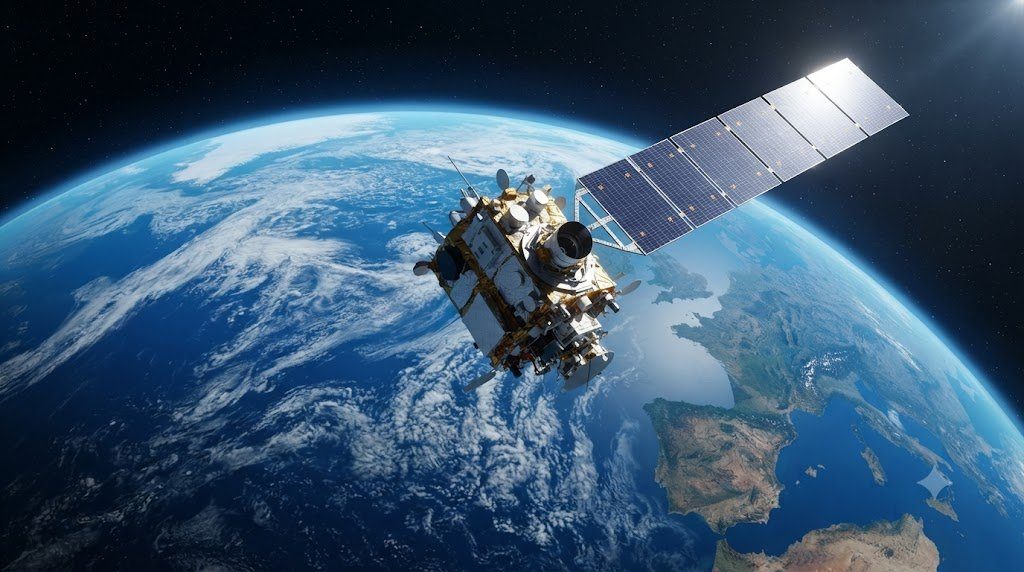
The launch of Earth-observing environmental satellites in polar and geostationary orbits revolutionized atmospheric physics. Today, an international constellation of sophisticated spaceborne instruments peers down upon our home planet 24 hours a day, slicing through clouds, measuring top-of-atmosphere radiative flux, detecting millimeter-scale sea level rise, tracking multi-ton ice mass loss from orbit, and measuring atmospheric trace gas concentrations with parts-per-billion sensitivity.
In this comprehensive satellite remote sensing monograph, we derive the physics of spaceborne radiative transfer, analyze passive and active multi-spectral radiometry, evaluate microwave radar altimetry, explore orbital gravimetry, and model LiDAR photon-counting altimetry.
1. The Electromagnetic Spectrum and Radiative Transfer Physics
Spaceborne remote sensing is governed by the Electromagnetic Wave Spectrum. Satellites do not touch the Earth; they detect electromagnetic photons emitted, scattered, or reflected by the planetary surface and atmosphere.
The spectral energy emitted by a blackbody radiator is defined by Planck’s Law:
B_\lambda(T) = \frac{2 h c^2}{\lambda^5 \left[ \exp\left( \frac{h c}{\lambda k_B T} \right) – 1 \right]}
Where $h$ is Planck’s constant, $c$ is speed of light, $k_B$ is Boltzmann’s constant, and $\lambda$ is wavelength. Integrating Planck’s function over all wavelengths yields the Stefan-Boltzmann Law ($E = \sigma T^4$). Taking the derivative yields Wien’s Displacement Law ($\lambda_{\text{max}} T = 2,898\text{ \mu m}\cdot\text{K}$):
- Solar Radiation (Shortwave): The sun ($T \approx 5,778\text{ K}$) emits peak energy in the visible spectrum ($\lambda_{\text{max}} \approx 0.5\text{ \mu m}$), spanning ultraviolet (0.2 μm) to shortwave infrared (3.0 μm). Satellites observe reflected sunlight during daylight.
- Terrestrial Planetary Radiation (Longwave Infrared): The Earth ($T \approx 288\text{ K}$) emits peak radiation in the thermal infrared ($\lambda_{\text{max}} \approx 10\text{ \mu m}$), spanning 4 μm to 100 μm. Satellites observe thermal infrared continuously day and night.
- Microwave Frequencies (1 mm to 1 meter): In the microwave spectrum, photon energies are low, but electromagnetic waves penetrate through clouds, rain, and dry snow, providing all-weather sensing capability!
2. Passive Multi-Spectral Radiometry: MODIS, VIIRS, and CERES
The workhorses of global surface and cloud monitoring are Passive Optical and Thermal Radiometers flying aboard sun-synchronous polar-orbiting satellites (such as NASA’s Terra and Aqua carrying MODIS, and NOAA/NASA’s Suomi-NPP and JPSS carrying VIIRS):
- Vegetation Dynamics (NDVI and EVI): MODIS utilizes red (645 nm) and near-infrared (858 nm) channels to measure chlorophyll absorption and leaf spongy mesophyll scattering. The Enhanced Vegetation Index (EVI) maps global photosynthetic activity, biomass growth, and drought crop failure at 250-meter resolution daily.
- Cloud Microphysics: By combining visible reflectance with 1.6 μm and 2.1 μm absorption channels, radiometers calculate Cloud Optical Thickness ($ au$) and Cloud Droplet Effective Radius ($r_e$), distinguishing liquid water clouds from ice crystal cirrus clouds.
- CERES and the Planetary Energy Imbalance: NASA’s Clouds and the Earth’s Radiant Energy System (CERES) radiometers measure the absolute Top-of-Atmosphere (TOA) radiative balance. CERES confirms that Earth is currently absorbing approximately 0.7 to 1.0 W/m² more energy than it radiates back to space—the fundamental empirical proof of human-induced planetary energy imbalance!
3. Microwave Sounders: Atmospheric Temperature and Water Vapor Profiling
While infrared radiometers are blocked by clouds, Passive Microwave Sounders (AMSU-A and ATMS) peer directly through cloud decks to measure temperature profiles throughout the atmospheric column:
Sounders exploit the strong magnetic dipole absorption resonance of Molecular Oxygen ($O_2$) centered around 54 to 60 GHz:
- Because oxygen is uniformly mixed throughout the global atmosphere (20.95% concentration), variations in microwave absorption are purely a function of atmospheric temperature and pressure!
- By tuning receivers to 15 discrete channels along the wing of the 60 GHz oxygen absorption band, each channel samples a different vertical altitude layer: channels near 50 GHz see down to the surface, while channels near 57 GHz see strictly into the stratosphere.
- The University of Alabama in Huntsville (UAH) and Remote Sensing Systems (RSS) utilize these microwave channels to construct the definitive 45-year continuous satellite temperature record of the lower troposphere (TLT) and lower stratosphere (TLS).
4. Satellite Radar Altimetry: Precision Global Sea Level Measurement
Perhaps the most remarkable triumph of spaceborne geophysics is the multi-decadal measurement of Global Mean Sea Level (GMSL) using satellite radar altimeters (TOPEX/Poseidon, Jason-1, Jason-2, Jason-3, and Sentinel-6 Michael Freilich):
Orbiting 1,336 kilometers above Earth in a precise 10-day repeating orbit, the altimeter fires thousands of dual-frequency radar pulses (Ku-band at 13.6 GHz and C-band at 5.3 GHz) per second at the ocean surface:
- Two-Way Travel Time Measurement: The radar measures the round-trip travel time of the reflected radar pulse with picosecond precision, calculating the raw range distance ($R = c \cdot \Delta t / 2$).
- Atmospheric Path Corrections: The pulse speed is slightly delayed by ionospheric free electrons, dry atmospheric gases, and wet tropospheric water vapor (measured by an onboard microwave radiometer). These corrections are subtracted.
- Precision Orbit Determination (POD): Using GPS receivers, laser retroreflector tracking from ground stations, and the French DORIS tracking network, the satellite’s exact radial position in space is known to an accuracy of less than 1.0 centimeter!
- Measuring Global Sea Level Rise: By subtracting range from orbital altitude, the satellite calculates Sea Surface Height (SSH) relative to the reference ellipsoid. Over 32 years of continuous data (1992–present), radar altimetry proves that global sea levels are rising at an accelerating rate: from 2.1 mm/year in the 1990s to over 4.5 mm/year today!
5. Satellite Gravimetry: GRACE and GRACE-FO Orbital Mass Flux
While radar altimetry measures surface elevation, NASA and GFZ’s Gravity Recovery and Climate Experiment (GRACE and GRACE-FO) satellites directly weigh the mass of water on planet Earth from orbit!
GRACE consists of twin satellites flying in tandem 220 kilometers apart at 500 km altitude. The satellites track the distance between each other using K-band microwave ranging and laser interferometry with sub-micrometer precision (measuring shifts smaller than a red blood cell!):
- Gravitational Anomaly Detection: When the lead satellite approaches a region of massive water accumulation (e.g., an Amazon flood or a thick ice sheet), the extra gravitational mass tugs the lead satellite forward, increasing the separation distance between the twins. As the trailing satellite passes over, it is pulled forward, closing the gap.
- Monthly Global Mass Flux Maps: Inverting these micro-distance fluctuations yields monthly maps of Earth’s variable gravitational field. GRACE tracks:
- Ice sheet mass collapse in Greenland (-270 Gt/yr) and Antarctica (-150 Gt/yr).
- Depletion of massive continental groundwater aquifers (e.g., Central Valley California, Northwestern India).
- Ocean mass expansion versus steric (thermal expansion) sea level contributions.
6. Spaceborne LiDAR: ICESat-2 and GEDI Photon-Counting Altimetry
The newest frontier in high-resolution orbital remote sensing is Spaceborne Light Detection and Ranging (LiDAR):
- NASA’s ICESat-2 (ATLAS Instrument): Fires a high-rate green laser (532 nm) splitting into six beams, pulsing 10,000 times per second. Unlike radar which averages over a wide footprint, ICESat-2 measures individual reflected photons from a tiny 11-meter footprint every 70 centimeters along the satellite track! This enables sub-centimeter vertical profiling of crevassed glacier outlets and sea ice freeboard height.
- NASA’s GEDI (Global Ecosystem Dynamics Investigation): Mounted on the International Space Station, GEDI fires three near-infrared lasers (1,064 nm) that penetrate forest canopies, digitizing the complete vertical 3D architecture of forests to quantify global vegetative carbon storage.
7. Comparative Sensor Matrix: Earth Observation Technologies
The following comparative matrix synthesizes the physics, wavelengths, and primary climate variables captured by spaceborne remote sensing systems:
| Remote Sensing Technology | Electromagnetic Wavelength | Operational Satellite Platform | Key Measurement Physical Quantity | Primary Climatological Application |
|---|---|---|---|---|
| Multi-Spectral Optical / Thermal | 0.4 to 14.0 µm (Visible to TIR) | MODIS, VIIRS, Sentinel-2, Landsat | Reflected solar radiance and thermal skin emission | Global vegetation indices (NDVI), cloud optical thickness, surface temperature |
| Broadband Radiometry | 0.3 to 100+ µm (Shortwave & Longwave) | CERES (Terra/Aqua/JPSS) | Top-of-Atmosphere (TOA) net radiative fluxes | Quantifying Earth’s planetary energy imbalance and cloud radiative forcing |
| Passive Microwave Sounding | 23 to 183 GHz (Microwave bands) | ATMS, AMSU-A, SSMIS | Oxygen dipole (60 GHz) and water vapor (183 GHz) emission | All-weather vertical atmospheric temperature and humidity profiling; sea ice extent |
| Radar Altimetry | 13.6 GHz (Ku-band) & 5.3 GHz (C-band) | Sentinel-6 Michael Freilich, Jason-3 | Two-way radar pulse travel time to ocean surface | Global mean sea level rise, ocean dynamic topography, geostrophic currents |
| Satellite Gravimetry | K-band microwave & Laser ranging | GRACE-Follow-On (GRACE-FO) | Inter-satellite distance variations (sub-micrometer) | Direct measurement of ice sheet mass loss, groundwater depletion, ocean mass |
| Photon-Counting LiDAR | 532 nm (Green Laser) & 1,064 nm (NIR) | ICESat-2 (ATLAS), GEDI (on ISS) | Time-of-flight of individual reflected photons | High-precision ice sheet elevation, sea ice freeboard, 3D forest biomass structure |
8. Atmospheric Chemistry Sounding: Sentinel-5P and OCO-2 Greenhouse Radiometry
Beyond physical temperature and water, satellites track atmospheric chemical composition and greenhouse gas emissions using High-Resolution Optical Absorption Spectrometry:
- Copernicus Sentinel-5P (TROPOMI Instrument): The TROPOspheric Monitoring Instrument measures reflected sunlight across ultraviolet, visible, near-infrared, and shortwave infrared bands at an astounding 5.5 x 3.5 km spatial resolution. TROPOMI maps global plumes of Methane ($CH_4$), Nitrogen Dioxide ($NO_2$), Carbon Monoxide ($CO$), Sulfur Dioxide ($SO_2$), and Ozone ($O_3$) daily, detecting localized methane leaks from oil and gas pipelines with pinpoint accuracy!
- NASA’s OCO-2 / OCO-3: Dedicated carbon observatory satellites measuring column-averaged carbon dioxide ($X_{CO2}$) by measuring absorption within the $1.61\ \mu ext{m}$ and $2.06\ \mu ext{m}$ $CO_2$ bands, mapping global sources and natural biospheric sinks.
9. Ocean Surface Vector Winds: Spaceborne Scatterometry
To measure wind speed and wind direction over the open world ocean where no weather stations exist, satellites deploy Microwave Scatterometers (ASCAT on MetOp satellites):
- Scatterometers transmit microwave radar pulses (C-band at 5.25 GHz) obliquely at the ocean surface.
- The radar waves undergo Bragg Scattering off centimeter-scale wind-generated capillary surface ripples.
- Higher wind speeds generate rougher capillary ripples, increasing the radar backscatter cross-section ($\sigma_0$). By observing backscatter from three separate antenna angles, specialized geophysical model functions invert the backscatter into Accurate 10-Meter Wind Speed and Wind Direction Vectors across the global ocean!
10. Open Data Access Platforms: Earthdata and Copernicus Open Access Hub
International space agencies provide complete, free, open-access public distribution of all Earth observation data:
- NASA Earthdata: Central portal providing access to multi-petabyte archives of MODIS, VIIRS, CERES, GRACE, and ICESat data via DAACs (Distributed Active Archive Centers).
- Copernicus Data Space Ecosystem: European portal providing programmatic API access to all Sentinel satellite streams (Sentinel-1 SAR, Sentinel-2 optical, Sentinel-3 ocean/land, Sentinel-5P atmosphere, and Sentinel-6 altimetry).
- Cloud Integration: Petabytes of satellite imagery are mirrored on Google Earth Engine, AWS Public Datasets, and Microsoft Planetary Computer, enabling global researchers to execute planetary-scale climate analyses in web browser consoles.
11. Wide-Swath Radar Interferometry: The SWOT Terrestrial Water Mission
For more than three decades, conventional satellite radar altimetry was constrained by a severe geometric limitation: instruments measured sea surface height along a single, razor-thin linear line directly beneath the satellite (nadir-only profiling), leaving massive unsurveyed gaps between orbital tracks. Furthermore, traditional radar footprints were too coarse to measure inland freshwater bodies, missing millions of lakes and rivers.
In December 2022, NASA and the French Space Agency (CNES) launched the revolutionary Surface Water and Ocean Topography (SWOT) Mission, ushering in the era of wide-swath radar interferometry:
- Ka-Band Radar Interferometer (KaRIn): SWOT deploys two radar antennas mounted at the ends of a 10-meter boom, operating at Ka-band (35.75 GHz, 8.6 mm wavelength). By measuring the microscopic phase difference between radar returns received at the two separate antennas, KaRIn maps elevation across a continuous 120-kilometer-wide surface swath!
- Sub-Kilometer Ocean Mesoscale Eddies: In the open ocean, SWOT resolves turbulent ocean eddies down to 15 to 20 kilometers in diameter—features that transport over 50% of the ocean’s vertical heat and carbon flux from the surface down into the abyss, which were completely invisible to previous satellites.
- Surveying Earth’s Surface Freshwater: For the first time in human history, SWOT maps the water surface elevation, width, and slope of virtually every river on Earth wider than 100 meters, and monitors surface water volume changes in over 6 million lakes larger than 250 meters square, transforming global flood prediction, transboundary water rights treaties, and catchment hydrological management.
12. Future Earth System Observatories: Multi-Angle Polarimetry and Aerosol Microphysics
The single greatest persistent uncertainty in modern radiative forcing and future climate projections remains the cooling influence and cloud-seeding effects of Atmospheric Aerosols and Cloud Feedbacks. Liquid droplets and microscopic solid particles scatter incoming sunlight and alter cloud brightness, but traditional radiometers cannot differentiate smoke from dust or sulfate aerosols.
To eliminate this uncertainty, international space agencies are deploying next-generation Multi-Angle Polarimetric Earth System Observatories—exemplified by NASA’s PACE (Plankton, Aerosol, Cloud, ocean Ecosystem) mission (launched in 2024) and the upcoming European EarthCARE satellite:
- Hyper-Angular Polarimetry (HARP-2 and SPEXone on PACE): Measures the intensity, angle, and degree of linear polarization ($DoLP$) of reflected sunlight from multiple viewing angles (up to 60 distinct angles per pixel) across ultraviolet to near-infrared wavelengths. Polarized light scattering physics resolves the exact particle size distribution, refractive index, non-spherical shape, and chemical composition of atmospheric aerosols from orbit!
- Hyperspectral Ocean Color Radiometry: PACE’s Ocean Color Instrument (OCI) measures continuous optical spectra from ultraviolet (350 nm) to near-infrared (885 nm) with 5 nm spectral resolution. Rather than seeing ocean water as generic “green,” OCI identifies distinct biological phytoplankton communities (diatoms, dinoflagellates, cyanobacteria), tracking the marine biological carbon pump in real time.
- Atmospheric Profiling Radars (EarthCARE CPR): Deploys a 94 GHz Doppler cloud profiling radar and high-spectral-resolution LiDAR to construct true 3D cross-sections of cloud vertical structure, resolving the complex interaction between aerosols, precipitation initiation, and cloud radiative heating that determines Earth’s ultimate climate sensitivity.