💻 Computational Meteorological Modeling & Data Assimilation
An exhaustive computational meteorology dissertation on global atmospheric reanalysis. We analyze four-dimensional variational data assimilation (4D-Var) cost function mechanics, compare the ECMWF ERA5 and NASA MERRA-2 reanalysis architectures, examine the integration of heterogeneous observation networks, and evaluate surface boundary layer energy balance modeling.
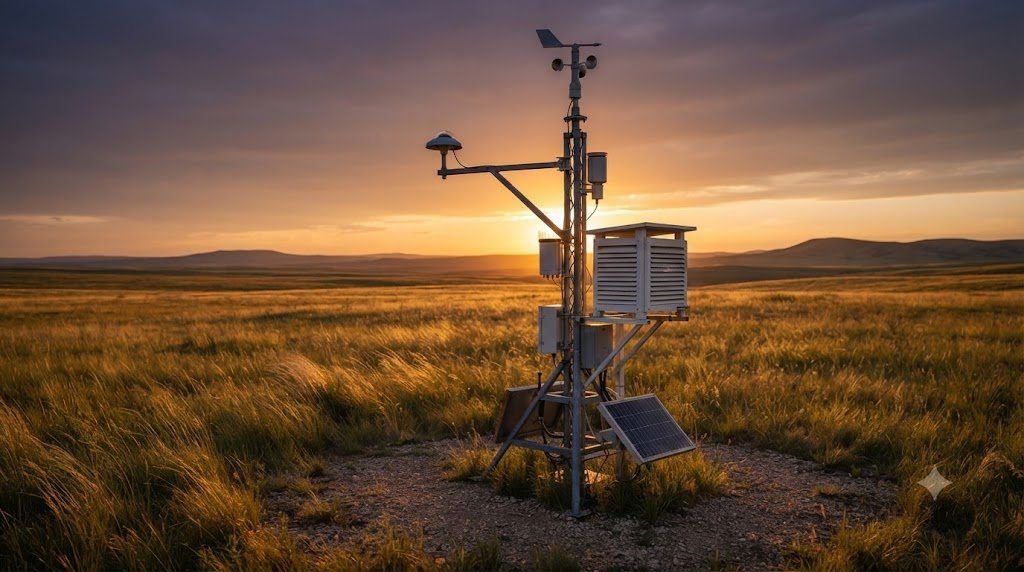
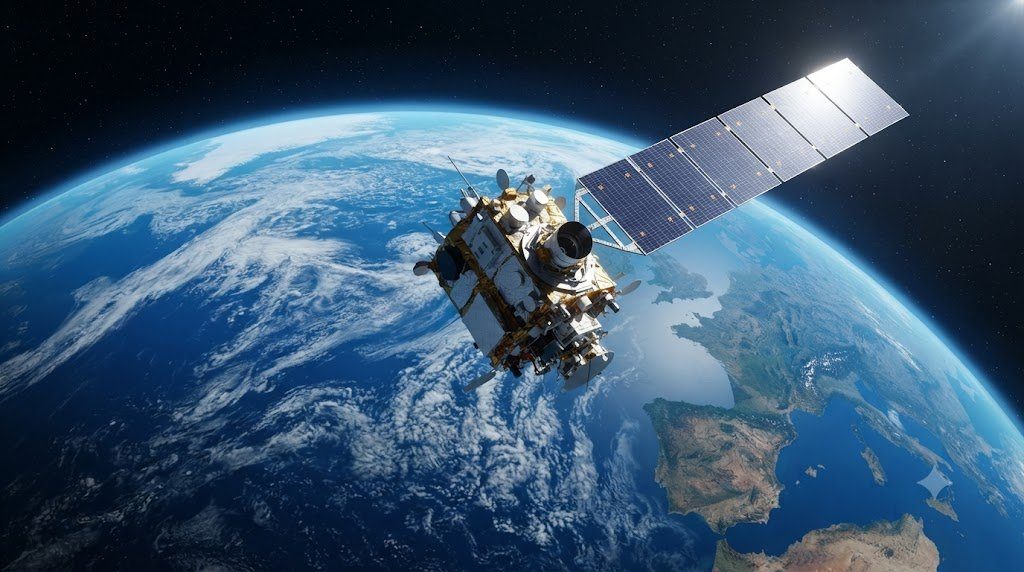
In modern observational climatology and meteorological research, no single instrument can measure every physical property of the global atmosphere continuously across space and time. Weather stations are densely clustered in prosperous mid-latitude cities, but sparse across tropical jungles, the high Arctic, and the Southern Ocean. Weather balloons sample the vertical atmosphere twice daily, but drift unpredictably with wind. Satellite radiometers provide global coverage, but measure uncalibrated spectral radiances rather than direct surface weather variables.
To bridge these observational gaps and synthesize billions of disparate, scattered physical observations into a continuous, physically consistent, 4D global record of past weather and climate, atmospheric science created the technology of Atmospheric Reanalysis. Produced by premier international meteorological computing centers—most notably the European Centre for Medium-Range Weather Forecasts (ECMWF) with ERA5 and NASA with MERRA-2—reanalyses serve as the undisputed “ground truth” datasets underpinning contemporary climate research, renewable energy forecasting, and global policy assessments.
In this comprehensive computational monograph, we dissect the mathematical physics of four-dimensional variational data assimilation (4D-Var), compare the modeling architectures of ERA5 and MERRA-2, analyze observation operator physics, and evaluate boundary layer parameterizations.
1. What is an Atmospheric Reanalysis? The Blending of Models and Observations
An Atmospheric Reanalysis is not a simple interpolation of weather station readings, nor is it an unconstrained climate model simulation. It is a mathematical synthesis that blends a state-of-the-art numerical weather prediction model with real-world empirical observations using advanced statistical Data Assimilation:
- The Flaw of Operational Forecasting Archives: Operational numerical weather prediction centers (such as ECMWF or the US NWS) have run forecast models for decades. However, over those decades, the underlying computer code changed repeatedly: model physics was updated, horizontal resolution was increased, and assimilation algorithms were replaced. Consequently, looking at historical forecast archives reveals artificial climatic “jumps” whenever a model was upgraded!
- The Reanalysis Solution (Frozen Model Physics): A reanalysis runs a single, fixed, state-of-the-art numerical modeling and data assimilation system over the entire historical observation period (e.g., from 1940 to the present). Every single day of past weather is re-analyzed using the exact same physical equations, completely eliminating model-induced biases!
- Physical Consistency: The output fields—temperature, barometric pressure, horizontal and vertical wind vectors, humidity, and radiative fluxes—are bound by the Navier-Stokes equations, mass conservation, and thermodynamics, producing a continuous, complete 4D raster of the planetary atmosphere.
2. Four-Dimensional Variational Data Assimilation (4D-Var) Mathematics
The mathematical heart of ECMWF’s ERA5 is Four-Dimensional Variational Data Assimilation (4D-Var). 4D-Var seeks the optimal atmospheric state trajectory ($x(t)$) over a finite time window (typically 12 hours) that minimizes a generalized Cost Function ($J(x_0)$):
J(x_0) = \frac{1}{2} (x_0 – x_b)^T \mathbf{B}^{-1} (x_0 – x_b) + \frac{1}{2} \sum_{i=0}^{N} \left[ y_i – \mathcal{H}_i(x(t_i)) \right]^T \mathbf{R}_i^{-1} \left[ y_i – \mathcal{H}_i(x(t_i)) \right]
Where:
- $x_0$ is the unknown atmospheric initial state vector to be solved.
- $x_b$ is the Background State (the “first guess” forecast from the previous model cycle).
- $\mathbf{B}$ is the Background Error Covariance Matrix, representing spatial and physical error correlations in the model forecast.
- $y_i$ is the vector of real-world observations collected at time $t_i$.
- $\mathcal{H}_i$ is the Observation Operator, a non-linear physical function mapping the model state into the exact physical quantity observed (e.g., converting model temperature and moisture profiles into spaceborne top-of-atmosphere radiance).
- $\mathbf{R}_i$ is the Observation Error Covariance Matrix (instrumental noise and representation error).
The system computes the gradient of the cost function ($\nabla J$) using the Adjoint Model, iteratively adjusting the atmospheric state until the trajectory simultaneously obeys atmospheric physics while matching real-world observations within error tolerances!
3. The ERA5 Reanalysis Architecture: Global Resolution and Vertical Stratification
Produced by ECMWF within the European Union’s Copernicus Climate Change Service (C3S), ERA5 (ECMWF Reanalysis v5) is the undisputed global benchmark for atmospheric reanalysis data:
- Horizontal Spatial Resolution: ERA5 runs on a reduced Gaussian grid (TCo639) with a horizontal resolution of approximately 31 kilometers (0.28125 degrees) across the entire planet. (An ensemble of 10 data assimilation members runs at 62 km resolution to quantify uncertainty).
- Vertical Coordinate System: Employs 137 hybrid sigma-pressure vertical levels extending from the surface up to 0.01 hPa (~80 km altitude), resolving the boundary layer, troposphere, stratosphere, and mesosphere!
- Temporal Resolution: Outputs global fields at hourly time steps (1-hour resolution) from 1940 to present, enabling research into rapid diurnal convection and extreme weather events.
- Data Ingestion Volume: ERA5 ingests and assimilates over 24 million observations per day, combining satellite radiances, radio occultation, aircraft reports (AMDAR), radiosondes, buoys, and surface stations!
4. NASA’s MERRA-2 Reanalysis: Coupled Aerosol Chemical Modeling
NASA’s primary atmospheric reanalysis is MERRA-2 (Modern-Era Retrospective analysis for Research and Applications, Version 2), generated by the Global Modeling and Assimilation Office (GMAO):
While ERA5 is renowned for high resolution and dynamical precision, MERRA-2’s defining scientific advantage is its fully coupled Aerosol Assimilation System:
- GOCART Aerosol Chemistry Integration: MERRA-2 integrates the Goddard Chemistry Aerosol Radiation and Transport (GOCART) model directly into the Goddard Earth Observing System (GEOS-5) atmospheric model.
- Aerosol Optical Depth (AOD) Assimilation: MERRA-2 assimilates satellite-derived Aerosol Optical Depth from MODIS (Terra and Aqua), MISR, and ground-based AERONET sun-photometers.
- Simulating 5 Aerosol Species: MERRA-2 provides continuous 3D fields of five distinct atmospheric aerosol species: Mineral Dust, Sea Salt, Black Carbon (soot), Organic Carbon (wildfire smoke), and Sulfate Aerosols. This allows researchers to track Saharan dust plumes crossing the Atlantic and smoke transport from mega-fires.
- Grid Specs: Operates at a horizontal resolution of $0.5^\circ imes 0.625^\circ$ with 72 hybrid vertical levels from 1980 to present.
5. Heterogeneous Observation Ingestion: From Radiosondes to Satellite Radiances
The true power of reanalysis lies in its ability to digest wildly disparate types of physical data into a single unified mathematical framework:
| Observation Source | Instrument Type | Measurement Physical Quantity | Observation Operator ($H(x)$) | Assimilated Coverage |
|---|---|---|---|---|
| Surface Weather Stations | SYNOP / METAR Barometers, Thermometers | Surface pressure, 2m temp, 10m wind, dewpoint | Direct spatial bilinear interpolation + height reduction | High density over land; sparse over oceans/poles |
| Weather Balloons (Radiosondes) | Vaisala RS41 GPS Radiosondes | Vertical T, q, u, v profiles to 10 hPa | Vertical spline interpolation onto model sigma levels | Twice daily (00Z and 12Z) global land launches |
| Commercial Aircraft (AMDAR) | Boeing/Airbus Avionics Sensors | In-flight wind velocity, temperature along flight path | 4D flight trajectory interpolation | Dense along major flight corridors; upper troposphere |
| Satellite Microwave Sounders | AMSU-A, ATMS on NOAA/MetOp satellites | Microwave brightness temperatures (Tb) | Radiative Transfer Model (RTTOV) simulating radiances | Global oceanic and land coverage; slices through clouds |
| Satellite Infrared Sounders | AIRS, IASI, CrIS hyperspectral radiometers | High-resolution infrared spectral radiances | RTTOV radiative transfer modeling (thousands of channels) | Global coverage; restricted to cloud-free fields of view |
| GNSS Radio Occultation (GNSS-RO) | COSMIC-2, MetOp GPS receivers | Bending angle of refracted GPS satellite radio signals | Abel transform mapping refractivity into T and q | Zero calibration drift; pristine benchmark for stratosphere |
6. Quality Control and Variational Bias Correction (VarBC)
Raw observation data is inherently noisy and contaminated by instrument calibration drifts. If uncorrected data were assimilated directly into a reanalysis, model fields would become corrupted. Reanalyses apply rigorous Quality Control (QC) and Variational Bias Correction (VarBC):
- Background Check (First-Guess Departure): If a station barometer or satellite pixel reports a value that deviates from the model background forecast by more than 3 to 5 standard deviations ($|y – \mathcal{H}(x_b)| > 3\sigma$), the observation is rejected as an instrument error or outlier.
- Variational Bias Correction (VarBC): Satellite sensors degrade over time in orbit, drifting by tenths of a degree. VarBC models the satellite bias as a linear function of state-dependent predictors (e.g., scan angle, optical air mass). Crucially, bias parameters are estimated dynamically inside the 4D-Var cost function itself! The system calibrates the satellites against “anchor observations” that possess zero drift—principally GNSS Radio Occultation bending angles and calibrated radiosondes.
7. Boundary Layer Parameterization and Surface Flux Modeling
Because physical processes in the planetary boundary layer—such as turbulence, soil moisture transport, and leaf transpiration—occur on scales far smaller than a 31-kilometer grid box, they must be mathematically Parameterized:
- Monin-Obukhov Similarity Theory: Models turbulent sensible and latent heat fluxes between the surface skin and the atmosphere based on stability functions ($\psi_m, \psi_h$):
Q_H = -\rho c_p C_H u_1 (T_1 – T_{\text{skin}}), \qquad Q_E = -\rho L_v C_E u_1 (q_1 – q_{\text{skin}})
- Land Surface Scheme (HTESSEL in ERA5): The Hydrology Tiled ECMWF Scheme for Surface Exchanges over Land (HTESSEL) partitions each grid cell into fractional tiles (bare ground, low vegetation, high vegetation, snow, open water). It models heat and moisture diffusion across four subterranean soil layers down to 2.89 meters depth, simulating root water uptake and freezing soil hydraulics.
8. Comparative Matrix: Major Global Climate Reanalysis Products
The following comparative matrix synthesizes the technical specifications, modeling agencies, and specialized capabilities of the world’s leading global climate reanalyses:
| Reanalysis Dataset | Operating Institution | Temporal Coverage | Horizontal / Vertical Resolution | Data Assimilation Mode | Key Scientific Strengths |
|---|---|---|---|---|---|
| ERA5 | ECMWF (European Union) | 1940 to Present (Near Real-Time) | 31 km horizontal; 137 vertical levels; 1-hourly | 4D-Var (12-hour window) | Gold standard for atmospheric dynamics, surface meteorology, wind energy, extreme events |
| MERRA-2 | NASA GMAO (USA) | 1980 to Present | 0.5° x 0.625° (~50 km); 72 vertical levels; 1-3 hourly | 3D-Var Gridpoint Statistical Interpolation (GSI) | Integrated aerosol chemistry (dust, smoke, sulfates); high-altitude stratosphere/mesosphere |
| JRA-55 / JRA-3Q | Japan Meteorological Agency (JMA) | 1958 to Present | TL319 (~55 km) / ~40 km; 60/128 vertical levels; 3-hourly | 4D-Var | Exceptional performance in Asian monsoon regions and tropical cyclone track modeling |
| NCEP CFSR / CFSv2 | NOAA / NCEP (USA) | 1979 to Present | T382 (~38 km); 64 vertical levels; 1-hourly | 3D-Var coupled ocean-atmosphere | Fully coupled ocean-atmosphere-sea-ice modeling; operational medium-range forecasting |
| 20CR (20th Century Reanalysis) | NOAA / CIRES / DOE | 1836 to 2015 | T254 (~75 km); 28 vertical levels; 3-hourly | Ensemble Kalman Filter (EnKF) | Ingests ONLY surface pressure observations; long 180-year baseline for historical extremes |
9. Known Systematic Biases and Uncertainties in Reanalysis Data
While reanalyses are extraordinary scientific tools, researchers must remain vigilant regarding documented systematic limitations:
- Precipitation is a Model-Forecast Product: Unlike surface pressure and temperature which are directly constrained by observational assimilation, precipitation is generated by the model’s convective parameterization scheme! Reanalyses do not directly assimilate rain gauge totals. Consequently, convective precipitation in tropical regions often exhibits timing and intensity biases.
- The Pre-Satellite Era Discontinuity (1979): Reanalysis reliability prior to 1979 is significantly lower in the Southern Hemisphere and over oceans because satellite radiance assimilation began only with the launch of modern sounding instruments in late 1978.
- Polar Boundary Layer Inversions: Extreme stable surface temperature inversions over Greenland and Antarctica challenge turbulence closure schemes, occasionally underestimating near-surface cryogenic cold.
10. Accessing Reanalysis Data: The Copernicus Climate Data Store (CDS)
Accessing modern reanalysis datasets is streamlined through open-access cloud infrastructure:
- The Copernicus Climate Data Store (CDS): Hosts the entire multi-petabyte ERA5 archive in standardized GRIB and NetCDF-4 formats. CDS provides a public REST API (
cdsapiPython package) allowing researchers to write automated scripts to download customized sub-regions and vertical slices. - Cloud Object Storage (AWS, Google Earth Engine, Azure): ERA5 and MERRA-2 are hosted as analysis-ready public datasets in cloud buckets in Zarr format, enabling massively parallel cloud computing with libraries like
Xarray,Dask, andPangeowithout downloading single files to local drives!
11. Regional High-Resolution Reanalyses: ERA5-Land and C3S Regional Downscaling
While global ERA5 provides unmatched consistency across the entire planet, its 31-kilometer horizontal resolution cannot fully resolve localized hydrological and topographical microclimates across complex terrain such as the Alps, the Rockies, or coastal archipelagos. To serve the needs of local hydrological engineering, wildfire risk modeling, and agricultural planning, ECMWF produced ERA5-Land:
ERA5-Land is a dedicated high-resolution global reanalysis of land-surface variables running at an extraordinary 9-kilometer spatial resolution (0.1 degrees) with hourly time steps from 1950 to the present:
- Thermodynamic Atmospheric Forcing: Rather than running an expensive coupled 4D-Var atmospheric assimilation at 9 km globally, ERA5-Land uses the atmospheric state from global ERA5 as an upper boundary condition, applying dynamic lapse-rate elevation adjustments to air temperature, humidity, and surface pressure.
- Enhanced HTESSEL Soil Physics: The land-surface scheme models soil moisture, soil temperature, snowpack accumulation, and surface runoff across four soil vertical layers at 9 km resolution. This resolves narrow mountain river valleys, snowpack water equivalent (SWE) along ski resort elevations, and regional soil drying during severe agricultural droughts with exquisite topographical fidelity.
- Copernicus Regional Reanalyses: In Europe and the Arctic, dedicated regional projects (such as CERRA running at 5.5 km resolution and CARRA for the Arctic at 2.5 km resolution) assimilate local high-density mesoscale surface observations, providing unmatched datasets for wind turbine siting, civil flood defenses, and Alpine glacier mass balance studies.
12. Future Frontiers: AI-Accelerated Neural Reanalysis and Machine Learning Emulators
Over the past four years, the intersection of artificial intelligence, high-performance GPU computing, and atmospheric physics has ignited a profound revolution in numerical reanalysis. Pioneering machine learning models developed by deep tech institutions—including Google DeepMind’s GraphCast, Huawei’s Pangu-Weather, NVIDIA’s FourCastNet, and ECMWF’s AIFS (Artificial Intelligence Forecasting System)—have achieved forecasting and interpolation accuracy that rivals or exceeds traditional physics-based numerical models at a fraction of the computational energy cost!
The transition toward Neural Machine Learning Reanalyses promises to transform data assimilation in three transformative dimensions:
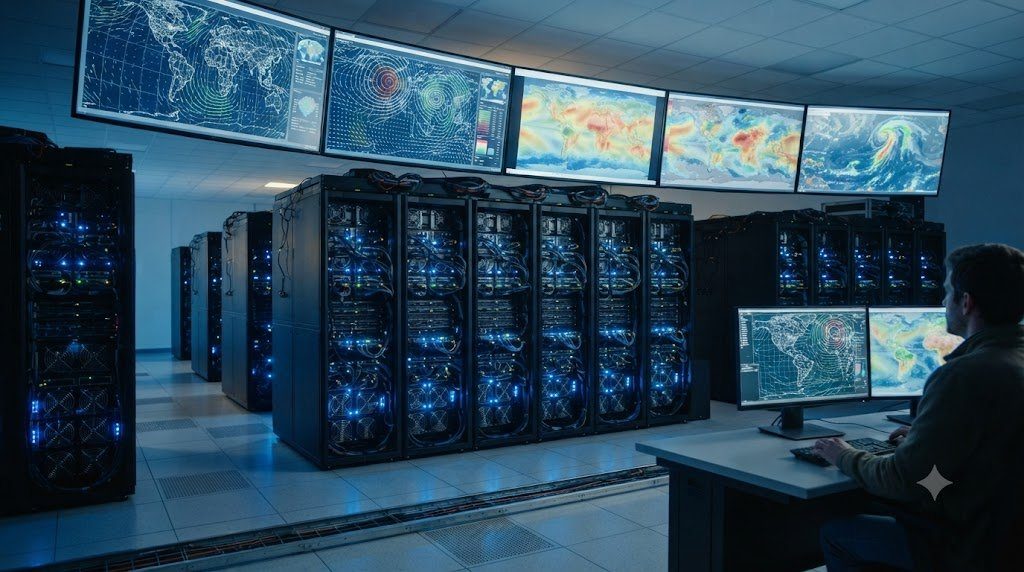
- Massive Energy and Computational Efficiency: Running a traditional global 4D-Var cycle requires thousands of high-performance CPU supercomputing cores running for hours, consuming megawatts of electricity. Trained deep neural networks (using Spherical Fourier Neural Operators and Graph Neural Networks) can generate a full global atmospheric analysis step on a single GPU cluster in under one second!
- Direct End-to-End Observation Ingestion: Future AI reanalysis systems are being trained to ingest uncalibrated satellite radiances, radar reflectivity volumes, and scattered surface station readings directly into latent representation spaces, bypassing the need for complex, hand-tuned physical radiative transfer operators.
- Multi-Decadal Fast Ensembles: By generating thousands of parallel stochastic ensemble members within minutes, AI reanalysis frameworks will provide rigorous, probabilistic quantifications of atmospheric uncertainty across historical extreme weather events, transforming how humanity models climate risk and infrastructure resilience.