CLIMATE DATA OBSERVATORY / GEOGRAPHY FIELD GUIDE
Twelve Months, Two Measurements, One Climate Story
Learn to interpret monthly temperature lines, rainfall bars, seasonal patterns, and annual climate statistics with confidence.
A climate graph can reveal a surprising amount about a place before you know anything else about its geography.
With just twelve months of information, it can show whether summers are hot, winters are cold, rainfall is spread evenly throughout the year, or a distinct wet season dominates the climate.
These graphs are commonly used in geography lessons, environmental studies, agriculture, and climate research.
However, they can look confusing at first because they often display two different measurements on the same chart.
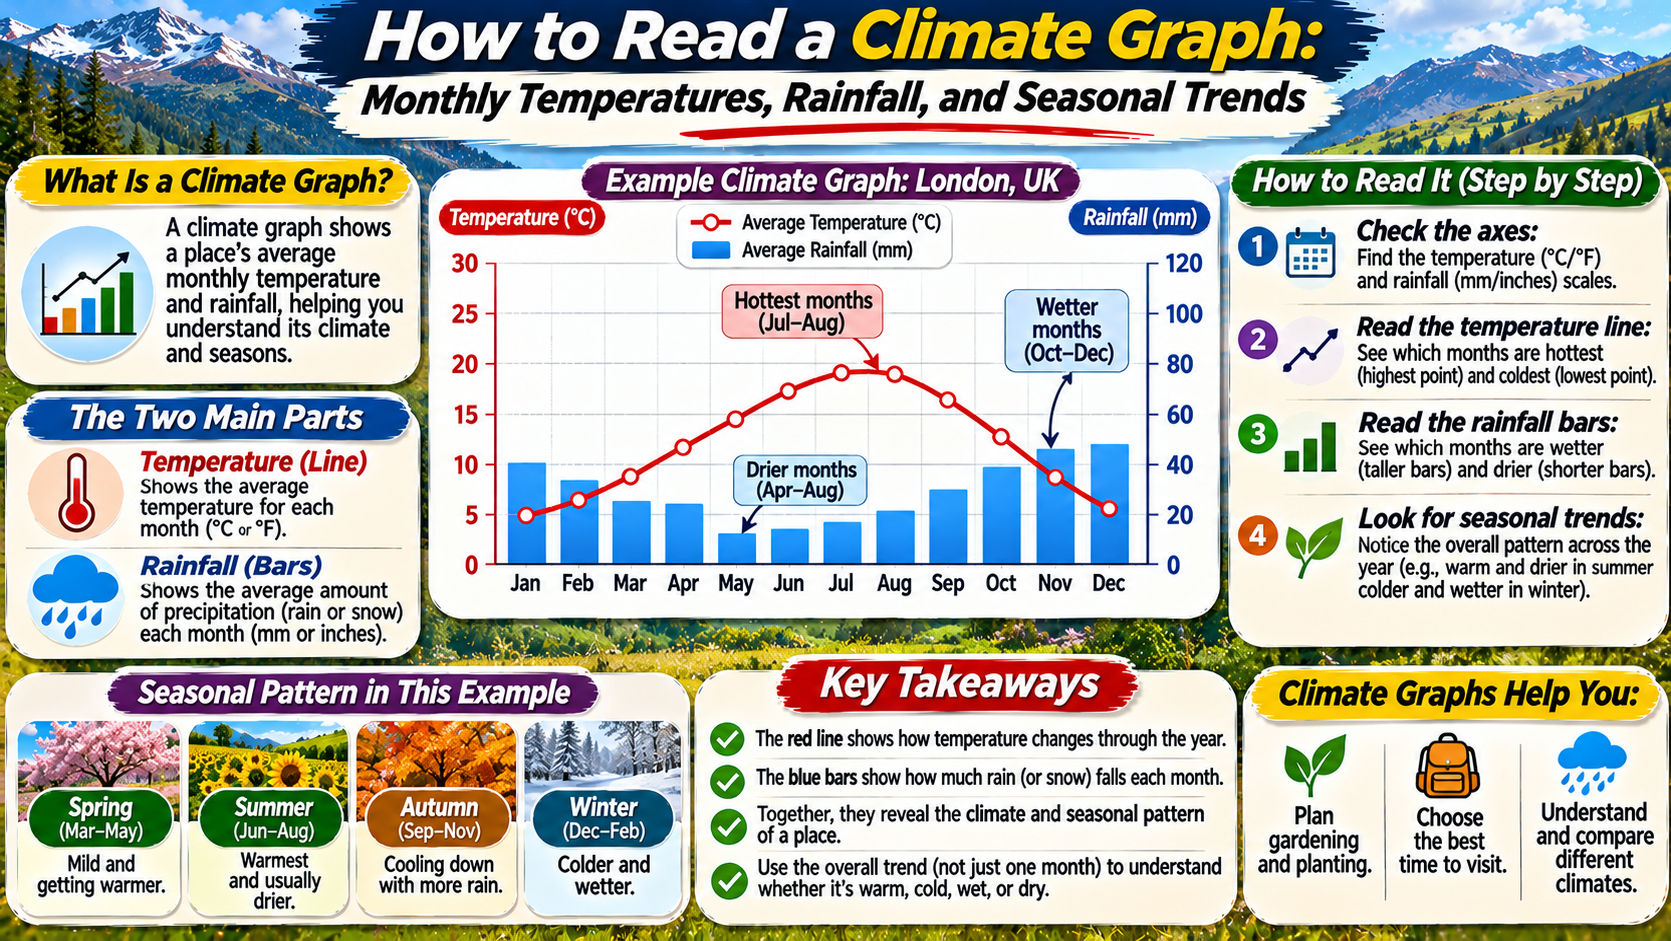
Temperature is usually shown as a line, while rainfall or total precipitation appears as vertical bars.
Each measurement has its own scale and unit.
The key to reading a climate graph is to examine the axes, understand what each symbol represents, and then compare the monthly patterns.
Once these basics are clear, climate graphs become useful tools for understanding the seasonal character of different regions.
What Is a Climate Graph?
A climate graph is a visual summary of typical temperature and precipitation conditions across the months of a year.
It is also commonly called a climograph or climate diagram.
Most classroom climate graphs use long-term monthly averages rather than measurements from one particular year.
For temperature, the graph may show the mean temperature for each month.
For precipitation, it usually displays the average total amount received during each month over a defined reference period.
Climate averages are often calculated using periods of several decades.
A commonly used standard for climate normals is a 30-year period.
These averages help describe typical conditions, but they do not show every unusual storm, heatwave, drought, or cold spell.
That distinction is important because climate describes longer-term patterns, while weather describes atmospheric conditions at a particular time.
The Three Main Parts of a Climate Graph
Before interpreting the seasonal pattern, identify the graph’s basic components.
1. The Horizontal Axis: Months
The horizontal axis usually runs from January through December.
It shows how conditions change throughout the calendar year.
Because the months are arranged in chronological order, the graph reveals seasonal patterns.
2. The Temperature Axis
Temperature is commonly displayed using degrees Celsius or degrees Fahrenheit.
A line connects the monthly temperature values.
Its rising and falling shape shows how the typical temperature changes during the year.
3. The Precipitation Axis
Precipitation is usually represented by vertical bars.
The values may be given in millimeters or inches.
Taller bars indicate months with more precipitation.
Always check which vertical axis belongs to which measurement because the scales are different.
DATA READING RULE / CHECK THE UNITS
Temperature and Rainfall Use Different Scales.
A line reaching the same height as a rainfall bar does not mean the temperature and rainfall have equal numerical values. Read each measurement against its corresponding axis.
How to Read the Temperature Line
Begin by following the temperature line from January to December.
Identify the warmest month and the coldest month.
Then examine how gradually or sharply temperatures change between them.
A relatively flat line suggests limited seasonal temperature variation.
A line with a large rise and fall indicates a greater difference between warm and cold seasons.
For example, a tropical location may remain warm throughout the year.
A continental location at a higher latitude may experience hot summers and cold winters.
The shape of the line can therefore provide clues about latitude, continental influence, and seasonal climate patterns.
However, elevation, ocean currents, and other geographic factors also affect temperature.
How to Read the Rainfall Bars
Next, examine the precipitation bars.
Look for the months with the highest and lowest values.
Notice whether precipitation occurs fairly evenly throughout the year or is concentrated in a particular season.
A graph with consistently tall bars may indicate a wet climate.
Low bars throughout the year may suggest an arid or semi-arid environment.
Some climates have a pronounced summer wet season.
Others receive more precipitation during winter.
It is also important to remember that precipitation includes more than rain.
Depending on the location and dataset, precipitation totals may include the water equivalent of snowfall and other forms of precipitation.
Therefore, a winter precipitation bar does not necessarily mean all the water fell as liquid rain.
A Sample Climate Graph Dataset
The following example uses fictional but realistic-looking monthly values to demonstrate how a climate graph can be interpreted.
These figures are illustrative and do not represent measurements from a specific city.
| Month | Mean Temperature (°C) | Precipitation (mm) |
|---|---|---|
| January | 5 | 70 |
| February | 6 | 55 |
| March | 9 | 60 |
| April | 13 | 50 |
| May | 17 | 65 |
| June | 21 | 75 |
| July | 24 | 85 |
| August | 23 | 80 |
| September | 19 | 70 |
| October | 14 | 65 |
| November | 9 | 75 |
| December | 6 | 80 |
The warmest month in this example is July, with a mean temperature of 24°C.
The coldest month is January, at 5°C.
The highest monthly precipitation total is 85 mm in July.
The lowest is 50 mm in April.
Because temperatures peak around July and August, the pattern is consistent with a Northern Hemisphere seasonal cycle.
However, the graph alone cannot identify the exact location.
How to Calculate Annual Temperature Range
The annual temperature range measures the difference between the warmest and coldest monthly mean temperatures.
It is calculated using a simple subtraction.
CLIMATE CALCULATION / TEMPERATURE RANGE
Warmest Monthly Mean − Coldest Monthly Mean
24°C − 5°C = 19°C
The illustrative location has an annual temperature range of 19°C.
A larger annual range often indicates stronger seasonal temperature contrasts.
Places far from the moderating influence of oceans may have relatively large annual temperature ranges.
Coastal locations frequently experience smaller temperature differences, although regional conditions vary.
How to Calculate Annual Precipitation
Annual precipitation is calculated by adding the precipitation totals for all twelve months.
Using the illustrative dataset, the monthly values add up to 830 mm.
This is the annual precipitation total represented by the example.
Remember that a graph showing long-term average monthly precipitation produces an average annual total when the monthly values are added.
It does not tell you how much precipitation fell in any particular year.
Individual years may be considerably wetter or drier than the long-term average.
How to Identify Wet and Dry Seasons
A wet season is a period when precipitation is relatively concentrated.
A dry season is a period when precipitation is substantially lower.
Some regions have sharply defined wet and dry seasons.
Monsoon-influenced climates are familiar examples of strong seasonal precipitation differences.
Other regions receive precipitation throughout the year without a clearly defined dry season.
When interpreting a climate graph, compare the bars across consecutive months rather than focusing on a single unusually high value.
Look for sustained patterns.
Also avoid assuming that the month with the lowest precipitation is automatically part of a true dry season.
Formal climate classifications may use specific precipitation and temperature thresholds to define dryness.
Northern vs Southern Hemisphere Climate Graphs
The timing of the warmest months can provide a clue about a location’s hemisphere.
In many Northern Hemisphere temperate climates, temperatures are highest around June, July, or August.
In Southern Hemisphere temperate climates, the warmest period commonly occurs around December, January, or February.
This seasonal reversal results from Earth’s axial tilt and its orbit around the Sun.
However, the pattern is not universal.
Tropical locations may have relatively small annual temperature differences.
Some regions experience temperature peaks before the main rainy season or have more complicated seasonal cycles.
Therefore, hemisphere identification should be treated as an inference supported by the graph, not an absolute rule.
How Climate Graphs Reveal Different Climate Types
Different climates produce recognizable combinations of temperature and precipitation patterns.
Tropical Climates
Tropical locations generally remain warm throughout the year.
Some receive abundant precipitation in every month.
Others have a pronounced wet season and a comparatively dry season.
Desert and Semi-Arid Climates
Dry climates have relatively limited precipitation compared with atmospheric moisture demand.
Some deserts experience extremely hot summers, while others have cooler seasonal conditions.
Low precipitation bars are an important clue, but climate classification requires more than visual inspection alone.
Temperate Maritime Climates
Locations influenced strongly by nearby oceans often experience moderated seasonal temperatures.
Precipitation may occur throughout the year, although seasonal differences can still be present.
Continental Climates
Continental climates often have greater seasonal temperature differences.
Summers may be warm or hot, while winters can be cold.
Precipitation patterns vary by region.
Why Climate Graphs Matter for Agriculture
Temperature and precipitation strongly influence crop growth.
Climate graphs can help farmers and gardeners understand the general seasonal conditions of a region.
For example, the temperature line may indicate when conditions are typically warm enough for certain crops.
Precipitation bars can show whether the growing season is usually wet or dry.
However, a climate graph cannot replace local weather forecasts or detailed agricultural planning.
It does not show individual frost events, rainfall intensity, soil moisture, or short-term drought conditions.
It is most useful as a broad guide to typical seasonal patterns.
Common Mistakes When Reading Climate Graphs
One frequent mistake is confusing the temperature and precipitation axes.
Another is assuming that the highest point on the temperature line and the tallest rainfall bar represent comparable values.
Students may also forget to check the units.
Temperature may be displayed in Celsius or Fahrenheit, while precipitation may be measured in millimeters or inches.
Another error is treating long-term averages as exact predictions for future weather.
Climate graphs summarize typical conditions but cannot predict the weather on a specific date.
Finally, readers sometimes identify a climate type from only one feature.
More reliable interpretation considers temperature, precipitation, seasonality, and geographic context together.
A Simple Five-Step Method for Reading Any Climate Graph
CLIMATE OBSERVATORY / READING SEQUENCE
Identify the months, temperature units, and precipitation units.
Find the warmest and coldest months and note the seasonal pattern.
Identify wetter and drier months and look for seasonal concentrations.
Find the annual temperature range and total annual precipitation.
Describe the seasonal trends and explain what they suggest about the location.
Frequently Asked Questions
What does a climate graph show?
A climate graph usually shows typical monthly temperature and precipitation patterns for a location.
Why are temperature and rainfall shown differently?
Temperature is commonly displayed as a line to highlight seasonal changes, while precipitation is shown as bars representing monthly totals.
How do you calculate annual temperature range?
Subtract the coldest monthly mean temperature from the warmest monthly mean temperature.
How do you calculate annual precipitation?
Add the precipitation values for all twelve months.
Can a climate graph identify a country’s hemisphere?
The timing of the warmest months may provide a clue, but tropical and unusual seasonal patterns can make the conclusion uncertain.
Is a climate graph the same as a weather forecast?
No. A climate graph summarizes typical long-term conditions, while a weather forecast predicts atmospheric conditions over a shorter period.
Can climate graphs show climate change?
A single graph describes conditions for a particular reference period. Comparing equivalent graphs or datasets from different periods can help investigate longer-term changes.
Final Thoughts
Climate graphs transform monthly temperature and precipitation data into an understandable picture of seasonal conditions.
The temperature line reveals how warmth changes during the year.
The precipitation bars show when a location typically receives more or less water.
By reading the axes carefully, identifying monthly extremes, and calculating annual values, readers can describe important climate characteristics.
These skills are useful in geography, environmental science, agriculture, and everyday climate education.
However, climate graphs should always be interpreted with an understanding of their limitations.
They summarize long-term patterns rather than every weather event.
With practice, a simple combination of lines and bars can reveal the seasonal rhythm of a landscape.